
Page 7 - Jan 2019 MFM.indd
P. 7
m
p
s
t
e
n
n
,
e
r
r
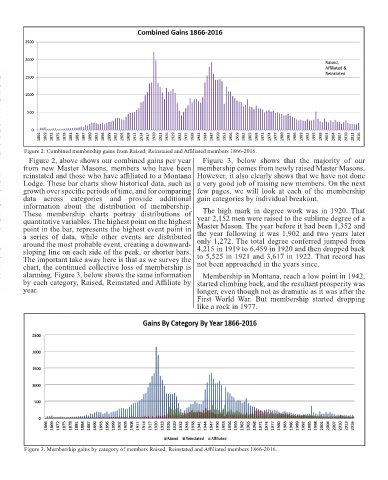
e Figure 2. Combined membership gains from Raised, Reinstated and Affi liated members 1866-2016.
Figure 2, above shows our combined gains per year Figure 3, below shows that the majority of our
from new Master Masons, members who have been membership comes from newly raised Master Masons.
t reinstated and those who have affi liated to a Montana However, it also clearly shows that we have not done
e Lodge. These bar charts show historical data, such as a very good job of raising new members. On the next
s growth over specifi c periods of time, and for comparing few pages, we will look at each of the membership
n data across categories and provide additional gain categories by individual breakout.
o information about the distribution of membership.
n These membership charts portray distributions of The high mark in degree work was in 1920. That
e quantitative variables. The highest point on the highest year 2,152 men were raised to the sublime degree of a
s point in the bar, represents the highest event point in Master Mason. The year before it had been 1,352 and
a series of data, while other events are distributed the year following it was 1,902 and two years later
around the most probable event, creating a downward- only 1,272. The total degree conferred jumped from
e sloping line on each side of the peak, or shorter bars. 4,215 in 1919 to 6,459 in 1920 and then dropped back
s to 5,525 in 1921 and 3,617 in 1922. That record has
d The important take away here is that as we survey the not been approached in the years since.
chart, the continued collective loss of membership is
d alarming. Figure 3, below shows the same information
Membership in Montana, reach a low point in 1942,
y by each category, Raised, Reinstated and Affi liate by started climbing back, and the resultant prosperity was
l
year. longer, even though not as dramatic as it was after the
First World War. But membership started dropping
like a rock in 1977.
Figure 3. Membership gains by category of members Raised, Reinstated and Affi liated members 1866-2016.